
Data Analytics Company
in Riverside
Over 49,402 developers hired since 2020



Trusted by 100+ companies and businesses


Reliable Data Analytics for Riverside Businesses
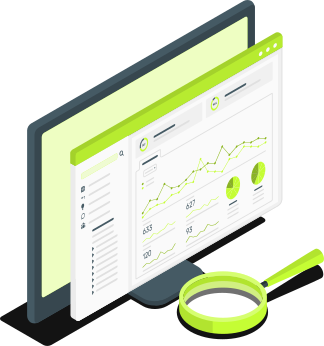
Devaims is a data analytics company that gives Riverside warehouses, hospitals, colleges, homebuilders, retailers and growers data analytics consulting and reporting they can act on. The Inland Empire is a major warehouse and distribution region, and companies here often track their work across separate warehouse, transport and finance systems. We join those systems in one warehouse, settle how each metric is calculated and build dashboards managers check at the start of each shift. Our analysts work remotely, and every report is handed over with documentation.
Data Analytics Services in Riverside
Our data analytics services in Riverside turn the data scattered across your systems into dashboards and reports you can trust. We connect your sources, build a clean data warehouse, design dashboards around the decisions you make and automate the reports your team builds by hand today. Every engagement starts with an assessment of your data and goals.
BI Dashboards
Business intelligence in Riverside with dashboards that show sales, operations and finance numbers in one place, updated automatically and easy to filter.
Data Warehousing
A central warehouse in Snowflake, BigQuery or a similar platform that combines your data sources into one reliable, well-documented model.
Reporting Automation
Recurring reports built automatically and sent on schedule, replacing hours of spreadsheet work every week with numbers that match.
Predictive Analytics
Forecasts of demand, revenue and churn built from your history, explained in plain language so managers can act on them.
Power BI and Tableau
Power BI and Tableau setup, report design and training, from a power BI consultant in Riverside who explains every number on the page.
Data Integration
Data stuck in separate systems? Our data integration team connects your CRM, ERP and apps so data flows on its own.
Your Riverside Data Analysts and Engineers

Your data analysts and engineers learn your business first and your data second. You get a named lead who turns your questions into metrics, clear documentation of where every number comes from and regular reviews of what the dashboards show. Every change to a report or data model is recorded, so your team can trust the numbers and understand them without calling us. We also run short training sessions, so your staff can build simple reports on their own.
Awards and Recognition





Over the past 15 years, our Data Analytics and IT solutions website has achieved significant industry acclaim. We're immensely proud of bagging the 'Best IT Solutions Provider' and 'Industry Leader in Data Analytics' awards, amongst many others. These accolades serve as a testament to our passion, innovation, and excellence in this field. We're committed to empowering businesses to leverage data and technology, one city at a time.
Data Analytics for Riverside Industries
Distribution centers, hospitals, a research university campus and community colleges, homebuilders, shopping centers and citrus growers all shape work in the region. Each sector keeps records in different systems. Here is how our analytics work supports each one.
Data Analytics for Logistics and Distribution
Logistics and distribution operators get dashboards for inbound trailer volume, dock-to-stock time, labor per unit and outbound on-time rates, combining WMS, yard management and carrier data. Site leaders see which shifts fall behind, and account managers report service levels to each customer with the same numbers.
Data Analytics for Healthcare
Healthcare providers get reporting on emergency department boarding, clinic access, staffing and denials from EHR and billing systems, with patient identifiers masked. Charge nurses and managers see their own units, and finance tracks how payer mix shifts over time.
Data Analytics for Higher Education
Higher education institutions use our dashboards to follow applications, transfer students, retention and course capacity, combining the student information system with admissions and aid records. Advisors see which students may stall, and planners add sections where demand is growing.
Data Analytics for Construction and Homebuilding
Construction and homebuilding companies get lot inventory, start-to-close cycle time, cost per house and warranty reporting from scheduling, purchasing and accounting systems. Division leaders see which communities run over budget, and sales teams track buyer traffic against closings.
Data Analytics for Retail
Retail businesses get store sales, margin, inventory and staffing reports, joining point-of-sale, e-commerce and labor data. District managers compare stores on the same figures, and buyers see which products move during back-to-school and holiday periods.
Data Analytics for Agriculture
Agriculture growers and packers get yield, harvest volume, water use and packing throughput dashboards from farm records, scale tickets and accounting data. Owners see cost and margin by block, and managers plan labor and irrigation with history in front of them.
Why Riverside Businesses Choose Devaims as Their Data Analytics Partner
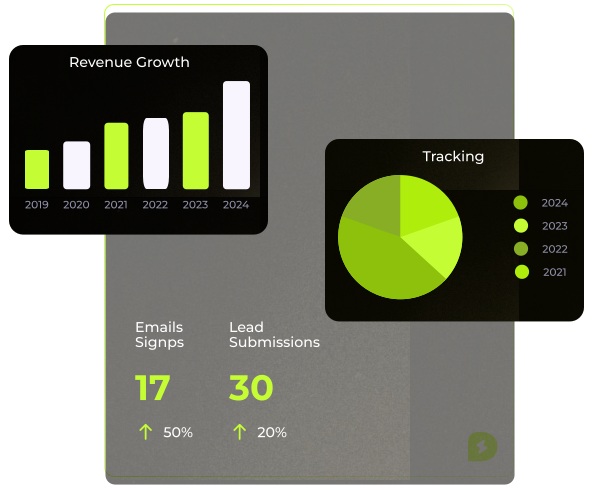
We agree the scope and the price after the assessment, so the cost is clear from the start. You own the data, the warehouse, the dashboards and the documentation, and everything runs in accounts in your name. Every metric is defined in writing, so finance, sales and operations see the same numbers. Data quality checks run every day, so problems are caught early. We train your team so reporting does not depend on us. That is why businesses choose us as their data analytics partner.
Tools and Platforms We Use
We work with the leading analytics and warehouse platforms, and choose what fits your data, your budget and your team's skills.
Power BI
Tableau
Looker
Snowflake
BigQuery
dbt
Python
SQL
What Is Included in Our Data Analytics
These are the services our analytics engagements can include. The exact scope is agreed after the assessment and written into your agreement.
Dashboards
KPI Tracking
Data Warehouse
Automated Reports
Forecasting
Data Cleaning
Self-Service BI
Alerts
Data Governance
Team Training
How We Onboard Riverside Clients
Our onboarding process starts with the decisions you want the data to support. We assess your sources, agree a data plan and a price, build the warehouse and dashboards in stages, review them with your team and keep the reports accurate as your business changes. You approve each step along the way.
-
1
Assessment
We review your data sources, current reports and key decisions, and report what we find.
-
2
Data Plan
We define the metrics, the data model, the dashboards and a price, all in writing.
-
3
Build
Engineers connect your sources, build the warehouse and create the first dashboards.
-
4
Review
We review every dashboard with the people who use it and fix numbers that do not match.
-
5
Ongoing Reporting
We monitor data quality, keep reports running and add new dashboards as you grow.
Data Analytics Companies in Riverside: How to Choose
Data analytics companies can all build a pretty chart. These five checks help you find one that delivers numbers your team trusts, documents where they come from and leaves you in control of your data.
-
Check Real Work
Ask to see dashboards they built for businesses like yours, and how those clients use them to make decisions.
-
Read Verified Reviews
Read reviews on independent sites and ask to speak with a current client whose data was similar to yours.
-
Confirm You Own Your Data
Make sure the data, warehouse and dashboards live in accounts you own, so you are never locked in to a provider.
-
Ask How They Communicate
Ask how metrics are defined and documented, and how your team will learn to use and change the reports.
-
Ask About Ongoing Support
Ask what support looks like after launch when a source changes or a number looks wrong, and how it is priced.
We've delivered 100+ Data Analytics projects for clients worldwide
Your project could be the next one on that list.
Serving Riverside and Nearby Areas
We work remotely with organizations across Riverside, including Downtown Riverside, Arlington, La Sierra and Orangecrest, as well as nearby Moreno Valley. Meetings and data reviews take place on video, and our analysts build inside your existing accounts, which keeps your data under your control the whole time.
- Downtown Riverside
- Arlington
- La Sierra
- Orangecrest
- Moreno Valley
- The rest of California
Data Analytics FAQs
How much does data analytics cost in Riverside?
The cost depends on the number of data sources, the volume of data, the number of dashboards and reports, and whether you need a one-off project or ongoing support. A single dashboard project costs far less than a full data warehouse with automated reporting across a business. After a short assessment we give you a written price, so you know the cost before work begins.
How fast can you start?
We start with an assessment of your data sources, current reports and the decisions you want to support. Once you approve the plan and the price, we set up access and begin with the most valuable dashboard first, so you see results early. The start date depends on access to your systems, and we agree it in writing before any work begins.
Do you offer on-site support in Riverside?
Our support is remote, which means we do not send analysts to your site unless the agreement says so. Pipelines, dashboards and staff training are all handled inside your own data platform, BI tools and chat. If a project needs hands-on work at your location, such as a session with warehouse supervisors on the floor, we set the cost and timing in writing before the engagement starts.
What response times do you guarantee?
Response targets for ongoing support are written into your agreement before work starts and are set by priority, so a broken data feed or a wrong number in a key report comes first and new requests are handled in order. We agree the targets with you, report on them every month and review them together whenever your reporting needs change.
Do you help with compliance (HIPAA, SOC 2, PCI)?
Yes. When your data includes health, payment or personal information, we build the warehouse and dashboards with the controls that HIPAA, SOC 2 and PCI DSS expect, such as access control, masking, encryption and audit logs. We document how data flows, who can see what and why. We do not issue certifications ourselves, but we work alongside your auditor or compliance lead.
How long are your contracts?
Contract length depends on the service and is agreed before work starts. Dashboard and warehouse projects end when the agreed reports are live and your team is trained. Ongoing support runs for a term that suits your planning, and we explain the notice period in plain language. Because everything runs in your accounts, you can change providers without losing anything.
How do I choose a data analytics provider in Riverside?
Check four things before you sign. Ask to see dashboards they built for businesses like yours. Read reviews on independent sites and talk to a current client. Confirm that the data and dashboards will live in accounts you own. Then ask how metrics are defined and documented. A provider that answers all four clearly is usually a safe choice for your business.
Other Services
Our Services
- Mobile App Development
- Software Development
- Website Development
- Web Design Company
- Managed IT Services
- Cloud Services
- IT Outsourcing
- Data Recovery
Data Analytics in other cities
- Data Analytics in Las Vegas
- Data Analytics in Baltimore
- Data Analytics in St. Louis
- Data Analytics in Portland
- Data Analytics in San Antonio
- Data Analytics in Sacramento
- Data Analytics in Austin
- Data Analytics in Orlando
Data Integration
- Data Integration in Riverside
- Data Integration in Las Vegas
- Data Integration in Baltimore
- Data Integration in St. Louis
- Data Integration in Portland
- Data Integration in San Antonio
- Data Integration in Sacramento
- Data Integration in Austin
Data Recovery
- Data Recovery in Riverside
- Data Recovery in Las Vegas
- Data Recovery in Baltimore
- Data Recovery in St. Louis
- Data Recovery in Portland
- Data Recovery in San Antonio
- Data Recovery in Sacramento
- Data Recovery in Austin
Cybersecurity
- Cybersecurity in Riverside
- Cybersecurity in Las Vegas
- Cybersecurity in Baltimore
- Cybersecurity in St. Louis
- Cybersecurity in Portland
- Cybersecurity in San Antonio
- Cybersecurity in Sacramento
- Cybersecurity in Austin
Data Analytics in nearby cities
- Data Analytics in Mission Viejo
- Data Analytics in Long Beach
- Data Analytics in Los Angeles
- Data Analytics in San Diego
- Data Analytics in Bakersfield
Other services in Riverside